

Investment Portfolio Tracker Excel Google Sheets Template (Digital Download)
$8.99 $11.99
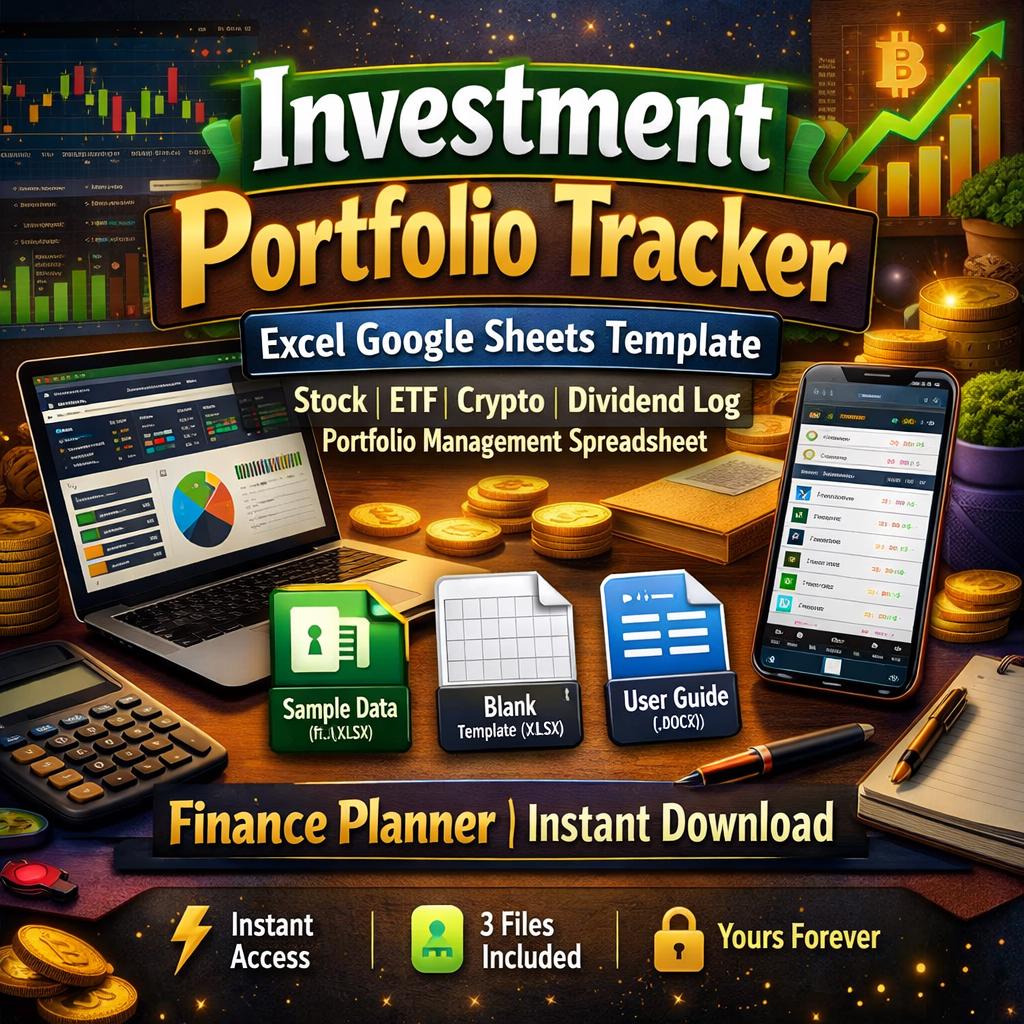
💼✨ Investment Portfolio Tracker — The Ultimate Excel & Google Sheets Financial Template
📥 3 FILES INCLUDED — Instant Digital Download
________________________________________
🎁 WHAT'S INSIDE YOUR DOWNLOAD
The moment you complete your purchase, three professional files are waiting in your Etsy downloads — no waiting, no shipping, no subscriptions. Ever.
________________________________________
📊 FILE 1 — Investment Portfolio Tracker WITH Sample Data (Microsoft Excel .xlsx) This fully loaded version comes pre-filled with realistic sample holdings, transactions, dividend entries, and monthly performance data. See every feature in action before you type a single number. Perfect for exploring the template, understanding how formulas connect across sheets, and learning the layout before you go live with your own portfolio.
________________________________________
🗂️ FILE 2 — Investment Portfolio Tracker BLANK Template (Microsoft Excel .xlsx) A completely clean, data-free version of the same professional workbook — wiped of all sample data but with every formula, dropdown menu, chart, hyperlink navigation button, conditional formatting rule, and color-coded layout fully intact and ready to use from day one. Open it, go to Settings, enter your name, and start building your portfolio tracker immediately.
________________________________________
📖 FILE 3 — Comprehensive Setup & User Guide (Microsoft Word .docx) A stunning 13-section professional reference document that covers every single feature of the template in thorough detail. Includes column-by-column field descriptions, step-by-step data entry walkthroughs, formula explanations, monthly maintenance routines, year-end rollover instructions, live price setup for both Excel and Google Sheets, a Do's and Don'ts table, a 10-problem troubleshooting section, and a printable first-time setup checklist. Open in Microsoft Word, Google Docs, or any Word-compatible reader.
________________________________________
💎 ABOUT THIS TEMPLATE
Stop juggling multiple apps, broker dashboards, and half-finished spreadsheets. This is the one-stop financial command center your portfolio has been waiting for.
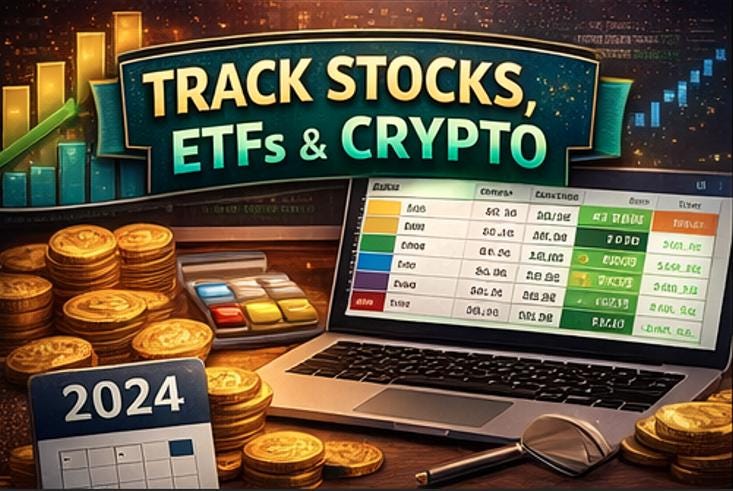
Whether you're a long-term index fund investor, an active stock trader, a dividend income builder, a crypto enthusiast, or managing a complex multi-account retirement strategy — this tracker was designed to handle it all, beautifully and automatically.
🚫 No subscriptions 🚫 No monthly fees 🚫 No complicated software ✅ One purchase — yours forever
________________________________________
🌟 WHY THOUSANDS OF INVESTORS LOVE THIS TEMPLATE
This isn't a basic spreadsheet with a few color bands and a SUM formula at the bottom. This is a fully automated, 9-sheet financial management system engineered with 2,300+ formulas, professional color-coded design, real-time-ready price integration, smart navigation, and the kind of depth that rivals premium investment apps — without the recurring cost.
🎨 Drop-Dead Gorgeous Design Dark navy, forest green, deep teal, burnt orange, royal purple, and gold accent sheets make this the most visually stunning portfolio tracker you've ever seen. Every sheet has its own distinct color theme, professional typography, polished section headers, and alternating row styling. This is a spreadsheet you will actually want to open every day.
⚡ Fully Automated — Just Enter Your Data Every calculation happens automatically. Enter a ticker symbol, quantity, purchase price, and current price — and the template instantly calculates current value, cost basis, unrealized gain or loss, percentage return, portfolio allocation, and more. Update one number and the entire workbook refreshes across all 9 sheets simultaneously.
🔗 One-Click Navigation System Eight large, color-coded button-style links on the Dashboard jump you directly to any sheet. Every data sheet has a Return to Dashboard button in its top-right corner. You are never more than one click away from wherever you need to be.
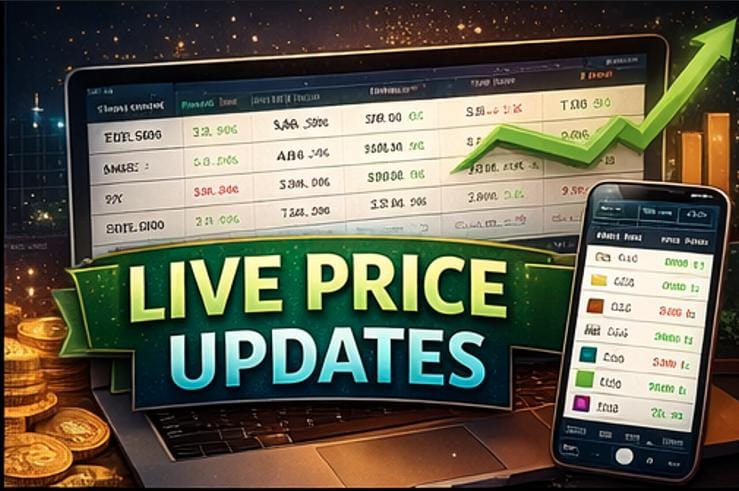
📡 Live Price Ready In Google Sheets, replace any manual price with =GOOGLEFINANCE("TICKER","price") for real-time quotes updated automatically. In Microsoft Excel 365, use the built-in Stocks data type to pull live prices directly from Microsoft's financial data feed. Manual price updates work equally well in both platforms.
🛡️ Built to Last — No Fragile Formulas Every formula uses IFERROR protection so empty rows stay clean with no ghost zeros or error messages. Blank rows look blank. Formulas only fire when you enter data. The workbook has been thoroughly tested and verified across both Excel and Google Sheets.
________________________________________
🗂️ THE 9 SHEETS — DETAILED BREAKDOWN
________________________________________
🏠 DASHBOARD Your portfolio command center. As soon as you open the workbook, six large live stat boxes greet you with your total portfolio value, total gain/loss in dollars and percent, year-filtered dividend income, total invested capital, and number of active holdings. A live Top Holdings table previews your first seven positions. Eight navigation buttons link to every sheet. The entire Dashboard updates automatically every time you change any data in the workbook.
________________________________________
⚙️ SETTINGS The single source of truth for your entire workbook. Enter your portfolio name, investor name, base currency, reporting year, broker or platform name, and email once — and every sheet header, info bar, dropdown menu, and stat label across the whole workbook populates from here automatically. Customize your account names (Brokerage, IRA, Roth IRA, 401k, Crypto Exchange, and more), asset categories, transaction types, and dividend types to perfectly match your real portfolio structure.
________________________________________
📖 INSTRUCTIONS A built-in quick-start guide embedded right inside the workbook. Includes a five-step setup walkthrough, Google Sheets import tips, a formula reference cheat sheet, and a critical reminder box about what not to change. Perfect for a quick refresher without needing to open the separate guide document.
________________________________________
📊 HOLDINGS The heart of the entire system. Log every investment position you currently own across every asset class. For each holding you track: ticker symbol, full asset name, asset type (dropdown), account (dropdown), purchase date, quantity, average purchase price, and current price. The template automatically calculates current value, cost basis, unrealized gain or loss in dollars, gain/loss percentage, and portfolio allocation percentage for every row. A summary box at the top of the sheet shows live totals for portfolio value, total cost, total gain/loss, overall return percentage, number of holdings, and average return. Supports up to 100 positions. Conditional color formatting turns gain/loss numbers green when positive and red when negative automatically.
________________________________________
🔄 TRANSACTIONS A complete, permanent audit trail of every trade you have ever made. Log every buy, sell, transfer in, transfer out, fee, and dividend reinvestment. For each trade you record the date, ticker, asset name, transaction type (dropdown), account (dropdown), quantity, price per unit, and any fees paid. The template auto-calculates total amount and net cash flow — correctly handling the fact that a Buy is a cash outflow, a Sell is a cash inflow, and a Transfer has zero cash impact. For Sell transactions, realized gain/loss is automatically calculated by looking up your purchase price from the Holdings sheet. Supports up to 200 transactions. Year-filtered summary boxes at the top show total buys, total sells, total fees, and trade counts for your current reporting year.
________________________________________
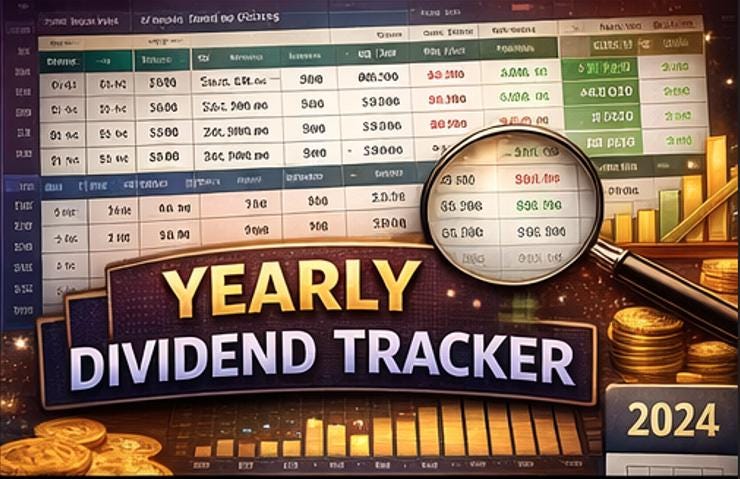
💰 DIVIDEND LOG Track every single dividend payment, REIT distribution, interest income, and capital gain distribution you receive. For each entry you record the ex-dividend date, pay date, ticker, asset name, account, dividend type (dropdown), shares held on record date, and dividend per share. The template auto-calculates gross dividend income. You enter any tax withheld and the net dividend (after tax) calculates instantly. A Reinvested? dropdown lets you flag DRIP entries. An automatic monthly income breakdown table below the main log groups all payments by month for the current reporting year — with January through December totals calculated automatically. A bar chart visualizes your monthly income at a glance. Supports up to 200 dividend entries.
________________________________________
🥧 PORTFOLIO ALLOCATION No data entry needed here — this sheet is 100% formula-driven. It presents your portfolio in three automatic views: allocation by asset type, allocation by account, and your top 10 holdings ranked by current value. Each view shows the number of holdings, total market value, percentage of total portfolio, total cost basis, and unrealized gain or loss for each category. A pie chart visualizes your asset type distribution. A bar chart shows value by account. Categories with no holdings automatically appear blank — no zeros, no clutter.
________________________________________
📈 PERFORMANCE TRACKING The sheet where your portfolio story unfolds over time. At the end of each month, log your start value, end value, any new contributions, any withdrawals, and total dividends received. The template automatically calculates capital gains for the period, total return in dollars, return percentage, and your performance versus a benchmark index you enter manually. Conditional formatting highlights outperforming months in green and underperforming months in red. A smooth line chart plots your portfolio value growth over time. A bar chart shows your monthly return percentage. Holds 54 months of data — over four years of history on a single sheet.
________________________________________
📋 SUMMARY REPORTS Your complete financial overview on one screen. Six large metric boxes display the headline numbers: total portfolio value, total cost basis, unrealized gain/loss, overall return percentage, total dividends YTD, and total invested. A second row shows number of holdings, number of transactions, dividend payment count, net dividends after tax, and total fees paid. A holdings summary table breaks performance down by asset type. A realized gains section shows transaction volume, sell proceeds, fees paid, and six dividend analytics metrics including dividend yield on cost. Everything updates automatically — no manual entry ever needed on this sheet.
________________________________________
🔢 WHAT GETS CALCULATED AUTOMATICALLY
✅ Current portfolio value (updates the moment you change a price) ✅ Cost basis per holding and for the total portfolio ✅ Unrealized gain/loss in dollars and as a percentage ✅ Portfolio allocation percentage per holding and per asset type ✅ Net cash flow per transaction (correctly calculated by transaction type) ✅ Realized gain/loss on every sell using your actual purchase price ✅ Gross and net dividend income per payment ✅ Monthly dividend totals filtered by your reporting year ✅ Monthly performance return in dollars and percent ✅ Alpha versus benchmark (outperformance or underperformance) ✅ Top 10 holdings auto-ranked by current market value ✅ Dividend yield on cost across your entire portfolio ✅ Year-filtered stats that change instantly when you update the year in Settings
________________________________________
💻 SOFTWARE COMPATIBILITY
This template is fully compatible with both major platforms and works identically in each — no conversion, no reformatting, no formula adjustments needed.
________________________________________
🟦 MICROSOFT EXCEL Compatible with Excel 2016, Excel 2019, Excel 2021, and Microsoft 365 on both Windows and Mac. All 2,300+ formulas, dropdown menus, charts, conditional formatting rules, and hyperlink navigation buttons work natively. Excel 365 users can additionally use the built-in Stocks data type for live real-time price updates directly in the Current Price column.
🟩 GOOGLE SHEETS Upload the .xlsx file to Google Drive and open with Google Sheets — all formatting, formulas, dropdowns, charts, and navigation hyperlinks transfer perfectly with zero modifications required. Google Sheets users can use the powerful =GOOGLEFINANCE("TICKER", "price") function for automatic real-time price updates for stocks, ETFs, and cryptocurrencies.
📝 MICROSOFT WORD (for the Guide only) The included User Guide (.docx) opens in Microsoft Word 2016 or later, Microsoft 365, and any Word-compatible application. Also opens in Google Docs via Drive upload.
________________________________________
📱 COMPATIBLE DEVICES
Use this tracker on any device where your spreadsheet app is installed — at your desk, on your couch, or on the go.
🖥️ Windows PC — Open directly in Microsoft Excel or access via browser through Microsoft 365 Online or Google Sheets
🍎 Mac (macOS) — Fully compatible with Microsoft Excel for Mac and Google Sheets in any browser
📱 iPhone & iPad — Use the free Microsoft Excel app (App Store) or the free Google Sheets app (App Store) to view and edit on any iOS device
🤖 Android Phone & Tablet — Use the free Microsoft Excel app or Google Sheets app (Google Play Store) to track your portfolio on any Android device
🌐 Any Web Browser — Access via sheets.google.com (Google Sheets) or office.com (Microsoft 365 Online) on any device with a browser — no software installation required whatsoever
☁️ Cloud Sync Compatible — Store and sync your file across all your devices using Google Drive, Microsoft OneDrive, Apple iCloud, or Dropbox for seamless access everywhere
________________________________________
📂 HOW TO IMPORT & EDIT THIS TEMPLATE
________________________________________
🟦 Opening & Editing in Microsoft Excel
1️⃣ After purchase, go to your Etsy account → Purchases and Reviews → click Download Files 2️⃣ Save all three files to your computer 3️⃣ Double-click the .xlsx file to open it in Microsoft Excel 4️⃣ If a yellow Protected View bar appears at the top, click Enable Editing 5️⃣ No macros are used — if any macro warning appears, simply dismiss it 6️⃣ Click the Settings tab at the bottom and fill in your personal details in the yellow highlighted cells 7️⃣ Navigate to Holdings using the Dashboard button and begin entering your investments 8️⃣ Save as a new file with your own name using Ctrl+S (Windows) or Cmd+S (Mac) — this preserves the original blank template untouched
________________________________________
🟩 Importing & Editing in Google Sheets
1️⃣ Download the .xlsx file from your Etsy purchases to your device 2️⃣ Open Google Drive at drive.google.com in any web browser 3️⃣ Click + New → File Upload and select the downloaded .xlsx file 4️⃣ Once uploaded, right-click the file in Drive → Open with → Google Sheets 5️⃣ Google Sheets opens the workbook — all formatting, formulas, charts, and dropdowns are intact 6️⃣ Click File → Save as Google Sheets to save a native copy to your Drive 7️⃣ Rename the file to something personal (e.g., "My Portfolio Tracker 2025") via File → Rename 8️⃣ Begin setup in the Settings sheet and enter your data in Holdings 9️⃣ Optionally add =GOOGLEFINANCE(B11,"price") to cells in the Current Price column for live prices
________________________________________
📱 Opening on Mobile (Excel App or Google Sheets App)
1️⃣ After downloading from Etsy on your desktop, save the .xlsx file to Google Drive, OneDrive, or iCloud 2️⃣ On your iPhone, iPad, or Android device, open the Google Sheets or Microsoft Excel app 3️⃣ Navigate to the cloud storage location where you saved the file and tap to open 4️⃣ All dropdowns, formulas, and formatting work fully on mobile 5️⃣ Edit data directly on your phone and changes sync automatically across all your devices via cloud storage
________________________________________
📖 Opening the User Guide
1️⃣ Open the .docx file in Microsoft Word on desktop or mobile 2️⃣ Alternatively, upload it to Google Drive and open with Google Docs for free browser-based access 3️⃣ The guide contains a clickable Table of Contents — use it to jump to any section instantly 4️⃣ Print it, save it to your desktop, or keep it open in a second window as you set up the template
________________________________________
________________________________________
🎯 THIS TEMPLATE IS PERFECT FOR
👤 Individual investors who want a clear, professional view of their total wealth in one place 🏦 Multi-account investors managing taxable brokerage, IRA, Roth IRA, 401(k), and crypto accounts simultaneously ₿ Crypto investors tracking Bitcoin, Ethereum, altcoins, and DeFi holdings alongside traditional assets 💵 Dividend income investors building passive income streams and monitoring yield, DRIP reinvestments, and monthly cash flow 📊 ETF and index fund investors tracking allocation drift and rebalancing needs across multiple fund types 📈 Active traders who need a permanent, organized log of every buy and sell for performance review and tax preparation 🌱 New investors who want to learn portfolio metrics, understand how returns are calculated, and build good financial tracking habits from day one 💼 Financial planners and advisors looking for a clean client-facing portfolio summary tool
________________________________________
________________________________________
❓ FREQUENTLY ASKED QUESTIONS
💬 Do I need any paid software? No. Microsoft Excel is available as a one-time purchase or through Microsoft 365. Google Sheets is completely free with any Google account. The User Guide opens in Microsoft Word or the free Google Docs.
💬 Can I customize the template? Absolutely. You can add notes, change colors, rename sections, and add additional rows. The User Guide explains clearly which cells are safe to edit and which formula cells should be left untouched.
💬 How do I update prices? In the Holdings sheet, simply type the new price in the Current Price column (column I). Every calculation across the workbook updates instantly. Alternatively, use GOOGLEFINANCE in Google Sheets or the Stocks data type in Excel 365 for automatic updates.
💬 Does it work for non-US stocks and currencies? Yes. You can set your base currency in Settings and track any asset in any currency. The template does not auto-convert currencies, but you can enter all values in your preferred base currency regardless of where securities are listed.
💬 Can I use this on multiple devices? Yes. Save your file to Google Drive, OneDrive, or iCloud and access it on any device — desktop, laptop, phone, or tablet — with your changes syncing automatically.
💬 What if I need help? Your purchase includes the comprehensive 13-section User Guide covering every feature in detail. If you have additional questions, please message the shop before purchasing and we'll be happy to help.
________________________________________
📌 INSTANT DIGITAL DOWNLOAD — NO WAITING
This is a 100% digital product. All three files are delivered immediately and automatically to your Etsy account the moment your payment is confirmed. No shipping. No waiting. No physical item.
To access your files: Etsy Account → Purchases and Reviews → Download Files
Files can be downloaded up to the number of times permitted by Etsy's download policy. Save copies to your preferred cloud storage immediately after downloading.
All digital product sales are final. Please review all images and the full description carefully before purchasing. Message the shop with any pre-purchase questions. 💬